Introduction
plyxp provides efficient abstractions to the
SummarizedExperiment such that using common dplyr functions
feels as natural to operating on a data.frame or
tibble. plyxp uses data-masking
from the rlang package in order to connect dplyr functions
to SummarizedExperiment slots in a manner that aims to be
intuitive and avoiding ambiguity in outcomes. For more details on the
design and benchmarking of plyxp, see Landis and Love (2026).
Enabling dplyr verbs
plyxp works on SummarizedExperiment objects, as
well as most classes derived from this, including DESeqDataSet,
SingleCellExperiment, etc.
It supports the following operations:
mutateselectsummarizepullfilterarrangegroup_by-
sliceandslice_*variants
Typical use case
library(plyxp)
# to use plyxp, call `new_plyxp()` on your SummarizedExperiment object
xp <- new_plyxp(airway)
# add data (mutate) to any of the three tables,
# assay, colData, rowData,
# ...using contextual helpers cols() and rows()
xp |>
  mutate(log_counts = log1p(counts),
         cols(treated = dex == "trt"),
         rows(new_id = paste0("gene-", gene_name)))
## # A RangedSummarizedExperiment-tibble Abstraction: 63,677 × 8
## .features .samples | counts log_counts | gene_id gene_name gene_biotype
## <chr> <chr> | <int> <dbl> | <chr> <chr> <chr>
## 1 ENSG000000000… SRR1039… | 679 6.52 | ENSG00… TSPAN6 protein_cod…
## 2 ENSG000000000… SRR1039… | 0 0 | ENSG00… TNMD protein_cod…
## 3 ENSG000000004… SRR1039… | 467 6.15 | ENSG00… DPM1 protein_cod…
## 4 ENSG000000004… SRR1039… | 260 5.56 | ENSG00… SCYL3 protein_cod…
## 5 ENSG000000004… SRR1039… | 60 4.11 | ENSG00… C1orf112 protein_cod…
## … … … … … … … …
## n-4 ENSG000002734… SRR1039… | 0 0 | ENSG00… RP11-180… antisense
## n-3 ENSG000002734… SRR1039… | 0 0 | ENSG00… TSEN34 protein_cod…
## n-2 ENSG000002734… SRR1039… | 0 0 | ENSG00… RP11-138… lincRNA
## n-1 ENSG000002734… SRR1039… | 0 0 | ENSG00… AP000230… lincRNA
## n ENSG000002734… SRR1039… | 0 0 | ENSG00… RP11-80H… lincRNA
## # ℹ n = 509,416
## # ℹ 7 more variables: new_id <chr>, `` <>, SampleName <fct>, cell <fct>,
## # dex <fct>, albut <fct>, treated <lgl>The operations can span contexts, and only the necessary data will be extracted from each context for computation:
# suppose a variable, `sizeFactor`, in the colData
xp$sizeFactor <- runif(8, .9, 1.1)

# we wish to scale the counts in the matrix using the size factor,
# then compute row means over the scaled counts matrix:
xp |>
  mutate(scaled_counts = counts / .cols$sizeFactor, #
         rows(ave_scl_cts = rowMeans(.assays_asis$scaled_counts)))
## # A RangedSummarizedExperiment-tibble Abstraction: 63,677 × 8
## .features .samples | counts scaled_counts | gene_id gene_name gene_biotype
## <chr> <chr> | <int> <dbl> | <chr> <chr> <chr>
## 1 ENSG000000… SRR1039… | 679 741. | ENSG00… TSPAN6 protein_cod…
## 2 ENSG000000… SRR1039… | 0 0 | ENSG00… TNMD protein_cod…
## 3 ENSG000000… SRR1039… | 467 510. | ENSG00… DPM1 protein_cod…
## 4 ENSG000000… SRR1039… | 260 284. | ENSG00… SCYL3 protein_cod…
## 5 ENSG000000… SRR1039… | 60 65.5 | ENSG00… C1orf112 protein_cod…
## … … … … … … … …
## n-4 ENSG000002… SRR1039… | 0 0 | ENSG00… RP11-180… antisense
## n-3 ENSG000002… SRR1039… | 0 0 | ENSG00… TSEN34 protein_cod…
## n-2 ENSG000002… SRR1039… | 0 0 | ENSG00… RP11-138… lincRNA
## n-1 ENSG000002… SRR1039… | 0 0 | ENSG00… AP000230… lincRNA
## n ENSG000002… SRR1039… | 0 0 | ENSG00… RP11-80H… lincRNA
## # ℹ n = 509,416
## # ℹ 7 more variables: ave_scl_cts <dbl>, `` <>, SampleName <fct>, cell <fct>,
## # dex <fct>, albut <fct>, sizeFactor <dbl>Calling .cols in the assay context produces an object of
the matching size and orientation to the other assay data.
Alternatively we could have used purrr to compute row means:
xp |>
  mutate(scaled_counts = counts / .cols$sizeFactor,
         # You may expect a list when accessing other contexts
         # from either the rows() or cols() contexts.
         rows(ave_scl_cts = purrr::map_dbl(.assays$scaled_counts, mean)))
## # A RangedSummarizedExperiment-tibble Abstraction: 63,677 × 8
## .features .samples | counts scaled_counts | gene_id gene_name gene_biotype
## <chr> <chr> | <int> <dbl> | <chr> <chr> <chr>
## 1 ENSG000000… SRR1039… | 679 741. | ENSG00… TSPAN6 protein_cod…
## 2 ENSG000000… SRR1039… | 0 0 | ENSG00… TNMD protein_cod…
## 3 ENSG000000… SRR1039… | 467 510. | ENSG00… DPM1 protein_cod…
## 4 ENSG000000… SRR1039… | 260 284. | ENSG00… SCYL3 protein_cod…
## 5 ENSG000000… SRR1039… | 60 65.5 | ENSG00… C1orf112 protein_cod…
## … … … … … … … …
## n-4 ENSG000002… SRR1039… | 0 0 | ENSG00… RP11-180… antisense
## n-3 ENSG000002… SRR1039… | 0 0 | ENSG00… TSEN34 protein_cod…
## n-2 ENSG000002… SRR1039… | 0 0 | ENSG00… RP11-138… lincRNA
## n-1 ENSG000002… SRR1039… | 0 0 | ENSG00… AP000230… lincRNA
## n ENSG000002… SRR1039… | 0 0 | ENSG00… RP11-80H… lincRNA
## # ℹ n = 509,416
## # ℹ 7 more variables: ave_scl_cts <dbl>, `` <>, SampleName <fct>, cell <fct>,
## # dex <fct>, albut <fct>, sizeFactor <dbl>See below for details on how objects are made available across contexts.
plyxp also enables common grouping and summarization
routines:
summary <- xp |>
  group_by(rows(gene_biotype)) |>
  summarize(col_sums = colSums(counts),
            # may rename rows with .features
            rows(.features = unique(gene_biotype)))
# summarize returns a SummarizedExperiment here,
# retaining rowData and colData

summary |> rowData()
## DataFrame with 30 rows and 1 column
## gene_biotype
## <character>
## protein_coding protein_coding
## pseudogene pseudogene
## processed_transcript processed_transcript
## antisense antisense
## lincRNA lincRNA
## ... ...
## IG_C_pseudogene IG_C_pseudogene
## TR_D_gene TR_D_gene
## IG_J_pseudogene IG_J_pseudogene
## 3prime_overlapping_ncrna 3prime_overlapping_n..
## processed_pseudogene processed_pseudogene
# visualizing the output as a tibble:
library(tibble)
summary |>
  pull(col_sums) |>
  as_tibble(rownames = "type")
## Warning: The `x` argument of `as_tibble.matrix()` must have unique column names if
## `.name_repair` is omitted as of tibble 2.0.0.
## ℹ Using compatibility `.name_repair`.
## This warning is displayed once per session.
## Call `lifecycle::last_lifecycle_warnings()` to see where this warning was
## generated.## # A tibble: 30 × 9
## type V1 V2 V3 V4 V5 V6 V7 V8
## <chr> <dbl> <dbl> <dbl> <dbl> <dbl> <dbl> <dbl> <dbl>
## 1 1 19413626 17741060 23926011 14360299 23003444 29233398 18114369 20103401
## 2 2 807285 733916 868950 478980 852106 946776 644006 633835
## 3 3 47547 46534 47788 26367 43965 52063 34563 35852
## 4 4 49682 43769 60098 33066 56696 66335 45654 45864
## 5 5 133335 120060 206075 125015 145078 170641 147563 149486
## 6 6 2804 2895 3417 2247 3497 4065 2508 2799
## 7 7 3 0 1 0 1 0 0 0
## 8 8 0 7 2 3 4 4 0 4
## 9 9 6038 5618 7662 5579 7869 9443 6580 6759
## 10 10 3560 3595 3963 2837 4503 5990 3320 3528
## # ℹ 20 more rowsTo extract the SummarizedExperiment (if needed):
se(xp)## class: RangedSummarizedExperiment
## dim: 63677 8
## metadata(1): ''
## assays(1): counts
## rownames(63677): ENSG00000000003 ENSG00000000005 ... ENSG00000273492
## ENSG00000273493
## rowData names(3): gene_id gene_name gene_biotype
## colnames(8): SRR1039508 SRR1039509 ... SRR1039520 SRR1039521
## colData names(5): SampleName cell dex albut sizeFactorRelated work
We note that plyxp is highly related to other
tidyomics projects including:
- tidySummarizedExperiment
- plyranges
- DFplyr
Here we have focused on the design principles of: (1) function endomorphism (returning the same class of object that was input), (2) avoiding code ambiguity through strictly defined behavior and scope, and (3) allowing the user the convenience of multiple expressions for the same result, which may involve a trade-off between efficiency and verbosity.
A note on tidySummarizedExperiment
Some of the optimized routines in plyxp for operating on
objects are called by some of the functions implemented in
tidySummarizedExperiment. plyxp and
tidySummarizedExperiment both provide dplyr-style
interfaces to SummarizedExperiment objects, and can easily be
loaded and used in the same R session without the functions conflicting.
By casting objects with the new_plyxp constructor, users
can enable the plyxp-driven functionality.
plyxp grammar
The SummarizedExperiment object contains three main
components/“contexts” that we mask, the assays(),
rowData()1 and colData().
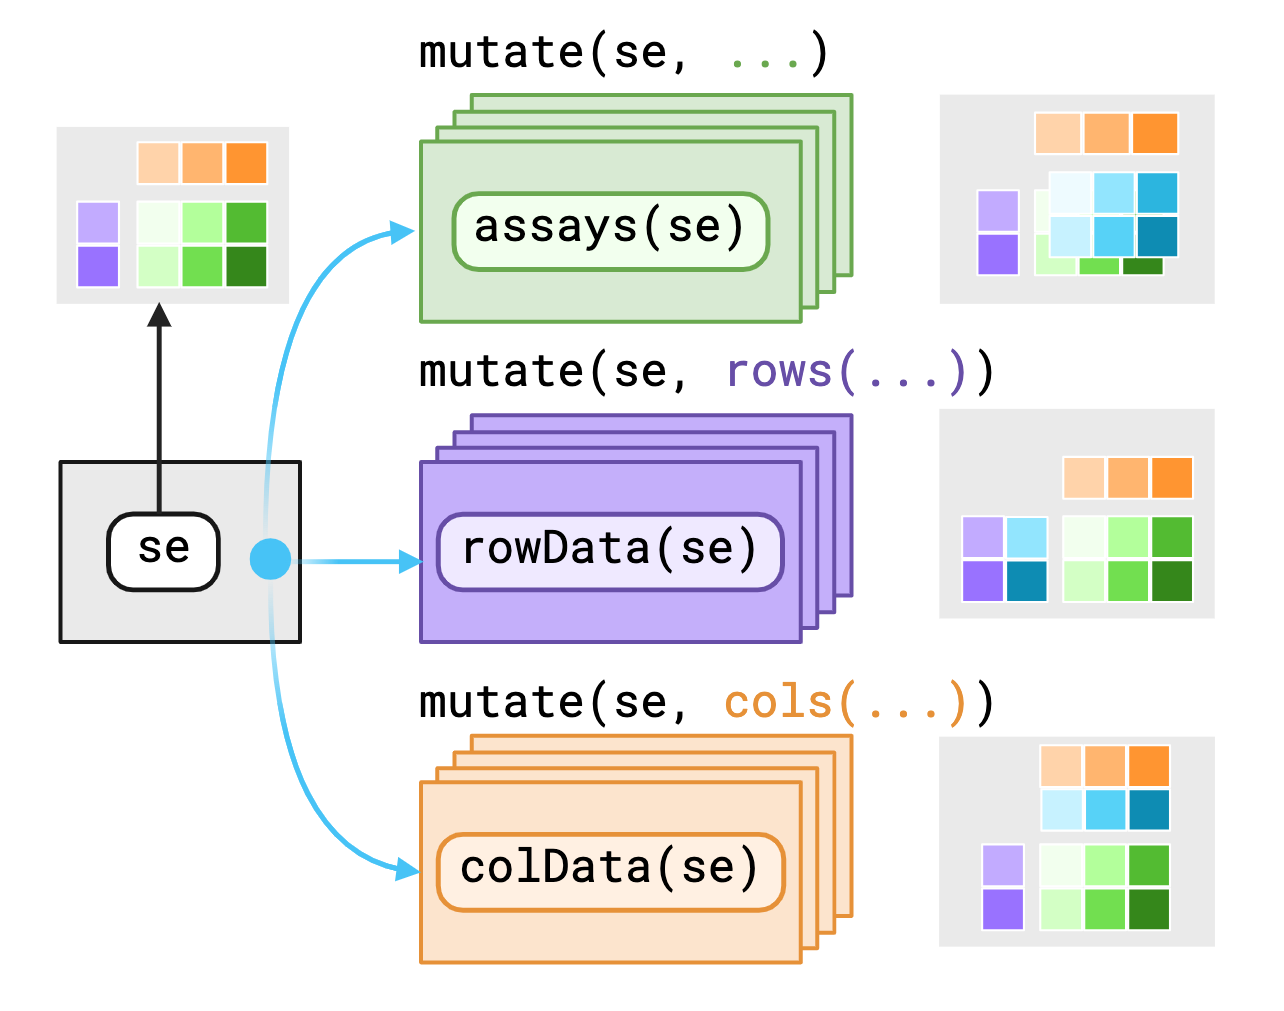
plyxp provides variables as-is to data within
their current contexts enabling you to call S4 methods on S4
objects with dplyr verbs. If you require access to
variables outside the context, you may use pronouns made
available through plyxp to specify where to find those
variables.
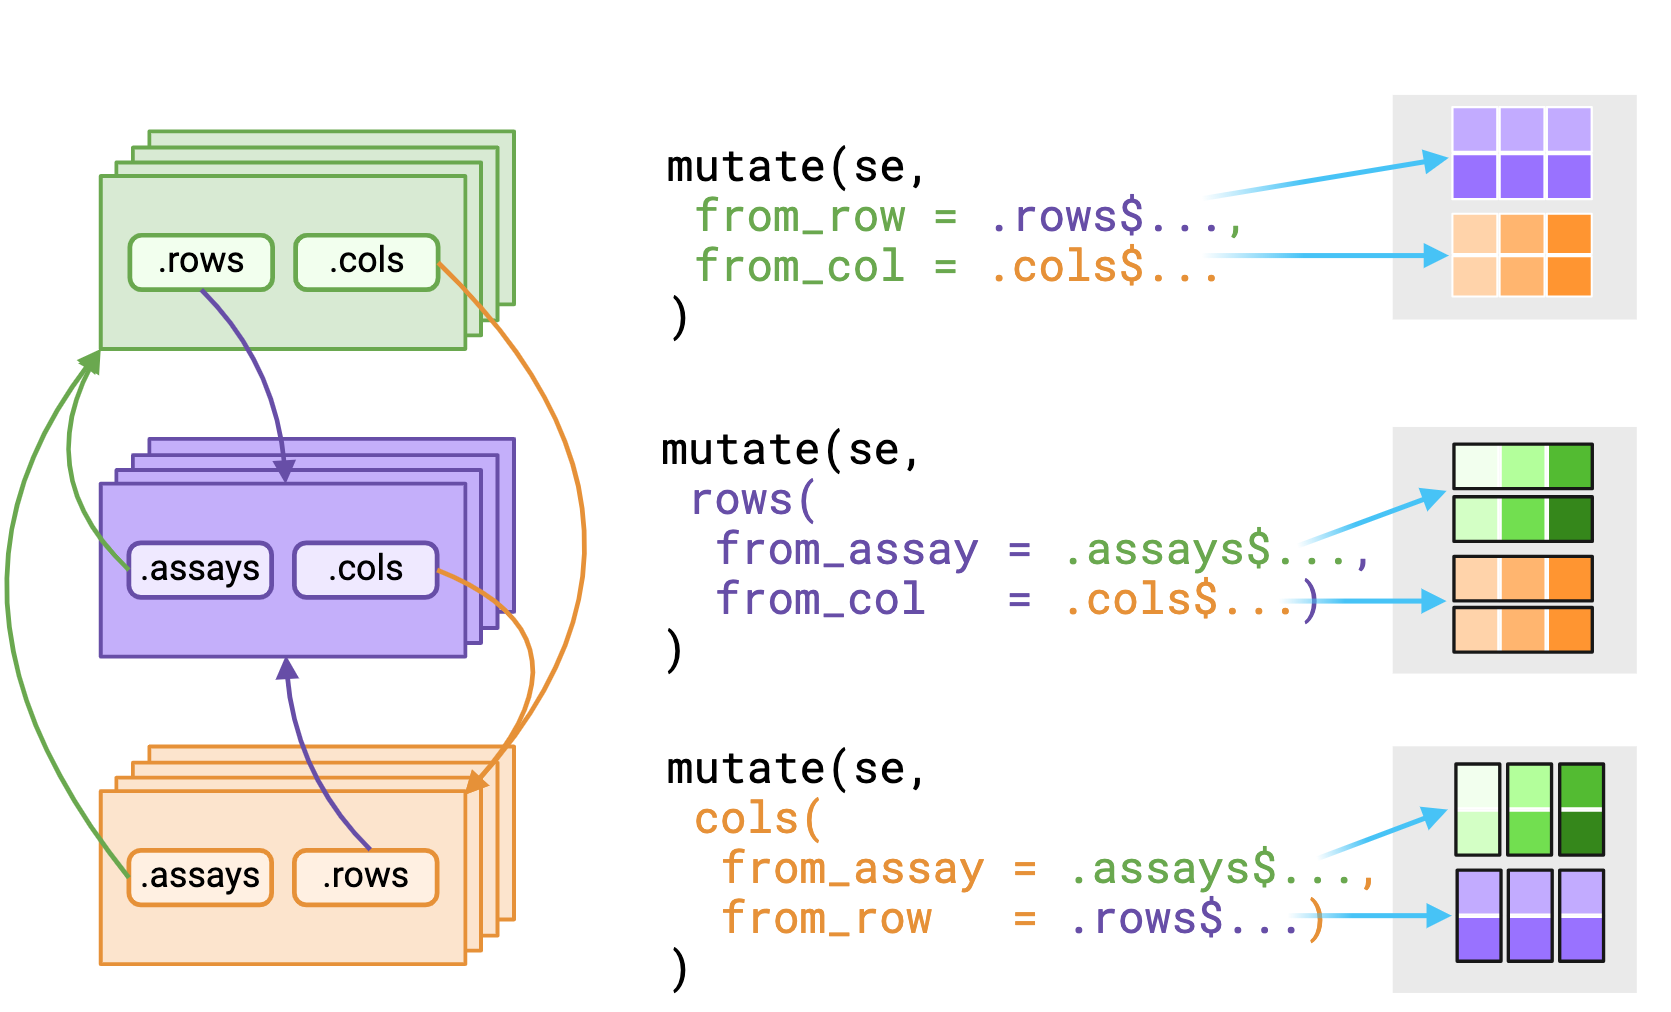
_asis variant that returns underlying data
without reshaping it to fit the context. Figure made with Biorender
The .assays, .rows and .cols
pronouns outputs depends on the evaluating context. Users should expect
that the underlying data returned from .rows or
.cols pronouns in the assays
context is a vector, replicated to match size of the assay
context.
Alternatively, using a pronoun in either the rows() or
cols() contexts will return a list equal in length to
either nrows(rowData()) or nrows(colData())
respectively.
assay context
- Default evaluation context
-
.assayscontextual pronoun, returns list of the matrix, sliced by the dimension it was referenced from.- within the rowData context:
.assays$foois an alias forlapply(seq_len(nrow()), \(i, x) x[i,,drop=FALSE], x = foo) - within the colData context:
.assays$foois an alias forlapply(seq_len(ncol()), \(i, x) x[,i,drop=FALSE], x = foo)
- within the rowData context:
-
.assays_asispronoun to direct bindings inassays() -
assay_ctx(expr, asis = FALSE)short hand to bind the assay context in front of the current context.
rows context
-
rows(...)sentinel function call to indicate evaluation context. -
.rowscontextual pronoun- within assay context:
.rows$foois an alias forvctrs::vec_rep(foo, times = ncol()) - within colData context:
.rows$foois an alias forvctrs::vec_rep(list(foo), times = n())
- within assay context:
-
.rows_asispronoun to direct bindings inrowData() -
row_ctx(expr, asis = FALSE)shorthand to bind the rowData context in front of the current context
cols context
-
cols(...)sentinel function call to indicate evaluation context. -
.colscontextual pronoun- within assay context:
.cols$foois an alias forvctrs::vec_rep_each(foo, times = nrow()) - within rowData context:
.rows$foois an alias forvctrs::vec_rep(list(foo), times = n())
- within assay context:
-
.cols_asispronoun to direct bindings incolData() -
col_ctx(expr, asis = FALSE)shorthand to bind the colData context in front of the current context
Multiple equivalent expressions
We can compare two ways of dividing out a vector from
colData along the columns of assay data:
# here the `.cols$` pronoun reshapes the data to fit the `assays` context
xp |>
  mutate(scaled_counts = counts / .cols$sizeFactor)
## # A RangedSummarizedExperiment-tibble Abstraction: 63,677 × 8
## .features .samples | counts scaled_counts | gene_id gene_name gene_biotype |
## <chr> <chr> | <int> <dbl> | <chr> <chr> <chr> |
## 1 ENSG0000… SRR1039… | 679 741. | ENSG00… TSPAN6 protein_cod… |
## 2 ENSG0000… SRR1039… | 0 0 | ENSG00… TNMD protein_cod… |
## 3 ENSG0000… SRR1039… | 467 510. | ENSG00… DPM1 protein_cod… |
## 4 ENSG0000… SRR1039… | 260 284. | ENSG00… SCYL3 protein_cod… |
## 5 ENSG0000… SRR1039… | 60 65.5 | ENSG00… C1orf112 protein_cod… |
## … … … … … … … …
## n-4 ENSG0000… SRR1039… | 0 0 | ENSG00… RP11-180… antisense |
## n-3 ENSG0000… SRR1039… | 0 0 | ENSG00… TSEN34 protein_cod… |
## n-2 ENSG0000… SRR1039… | 0 0 | ENSG00… RP11-138… lincRNA |
## n-1 ENSG0000… SRR1039… | 0 0 | ENSG00… AP000230… lincRNA |
## n ENSG0000… SRR1039… | 0 0 | ENSG00… RP11-80H… lincRNA |
## # ℹ n = 509,416
## # ℹ 5 more variables: SampleName <fct>, cell <fct>, dex <fct>, albut <fct>,
## # sizeFactor <dbl>
# this is equivalent to the following, where we have to transpose
# the `counts` assay data twice to enable the correct recycling
# of the size factor vector
xp |>
  mutate(scaled_counts = t(t(counts) / .cols_asis$sizeFactor))
## # A RangedSummarizedExperiment-tibble Abstraction: 63,677 × 8
## .features .samples | counts scaled_counts | gene_id gene_name gene_biotype |
## <chr> <chr> | <int> <dbl> | <chr> <chr> <chr> |
## 1 ENSG0000… SRR1039… | 679 741. | ENSG00… TSPAN6 protein_cod… |
## 2 ENSG0000… SRR1039… | 0 0 | ENSG00… TNMD protein_cod… |
## 3 ENSG0000… SRR1039… | 467 510. | ENSG00… DPM1 protein_cod… |
## 4 ENSG0000… SRR1039… | 260 284. | ENSG00… SCYL3 protein_cod… |
## 5 ENSG0000… SRR1039… | 60 65.5 | ENSG00… C1orf112 protein_cod… |
## … … … … … … … …
## n-4 ENSG0000… SRR1039… | 0 0 | ENSG00… RP11-180… antisense |
## n-3 ENSG0000… SRR1039… | 0 0 | ENSG00… TSEN34 protein_cod… |
## n-2 ENSG0000… SRR1039… | 0 0 | ENSG00… RP11-138… lincRNA |
## n-1 ENSG0000… SRR1039… | 0 0 | ENSG00… AP000230… lincRNA |
## n ENSG0000… SRR1039… | 0 0 | ENSG00… RP11-80H… lincRNA |
## # ℹ n = 509,416
## # ℹ 5 more variables: SampleName <fct>, cell <fct>, dex <fct>, albut <fct>,
## # sizeFactor <dbl>Advanced features
Object integrity
plyxp provides an opinionated framework for how
dplyr verbs should interact with
SummarizedExperiment objects. In general,
plyxp will not allow any operations that it could not
guarantee a valid return object.
It is for this reason that arrange(),
filter() and group_by() do not allow
operations in the default assay context, as this would likely break the
assumed structure of a SummarizedExperiment object.
Grouping
plyxp also supports group_by operations
allowing users to query information with dplyr::n() or
dplyr::cur_group_id(). However due to the linked structure
of a SummarizedExperiment object and plyxp
providing multiple evaluation contexts, grouping operations would be
complex and return values would be potentionally ambiguous.
It is for this reason that groupings are themselves contextual. The assay context is dependently linked to both the groupings of the rows and cols contexts but, the grouping of rows is ignored when viewed from the cols context and similarly the grouping of cols is ignored when viewed from the rows context. In this way, we have chosen to make the groupings of rows and cols independent between each other. The below figure attempts to show how groupings are conditionally dropped for the scope of an evaluation.
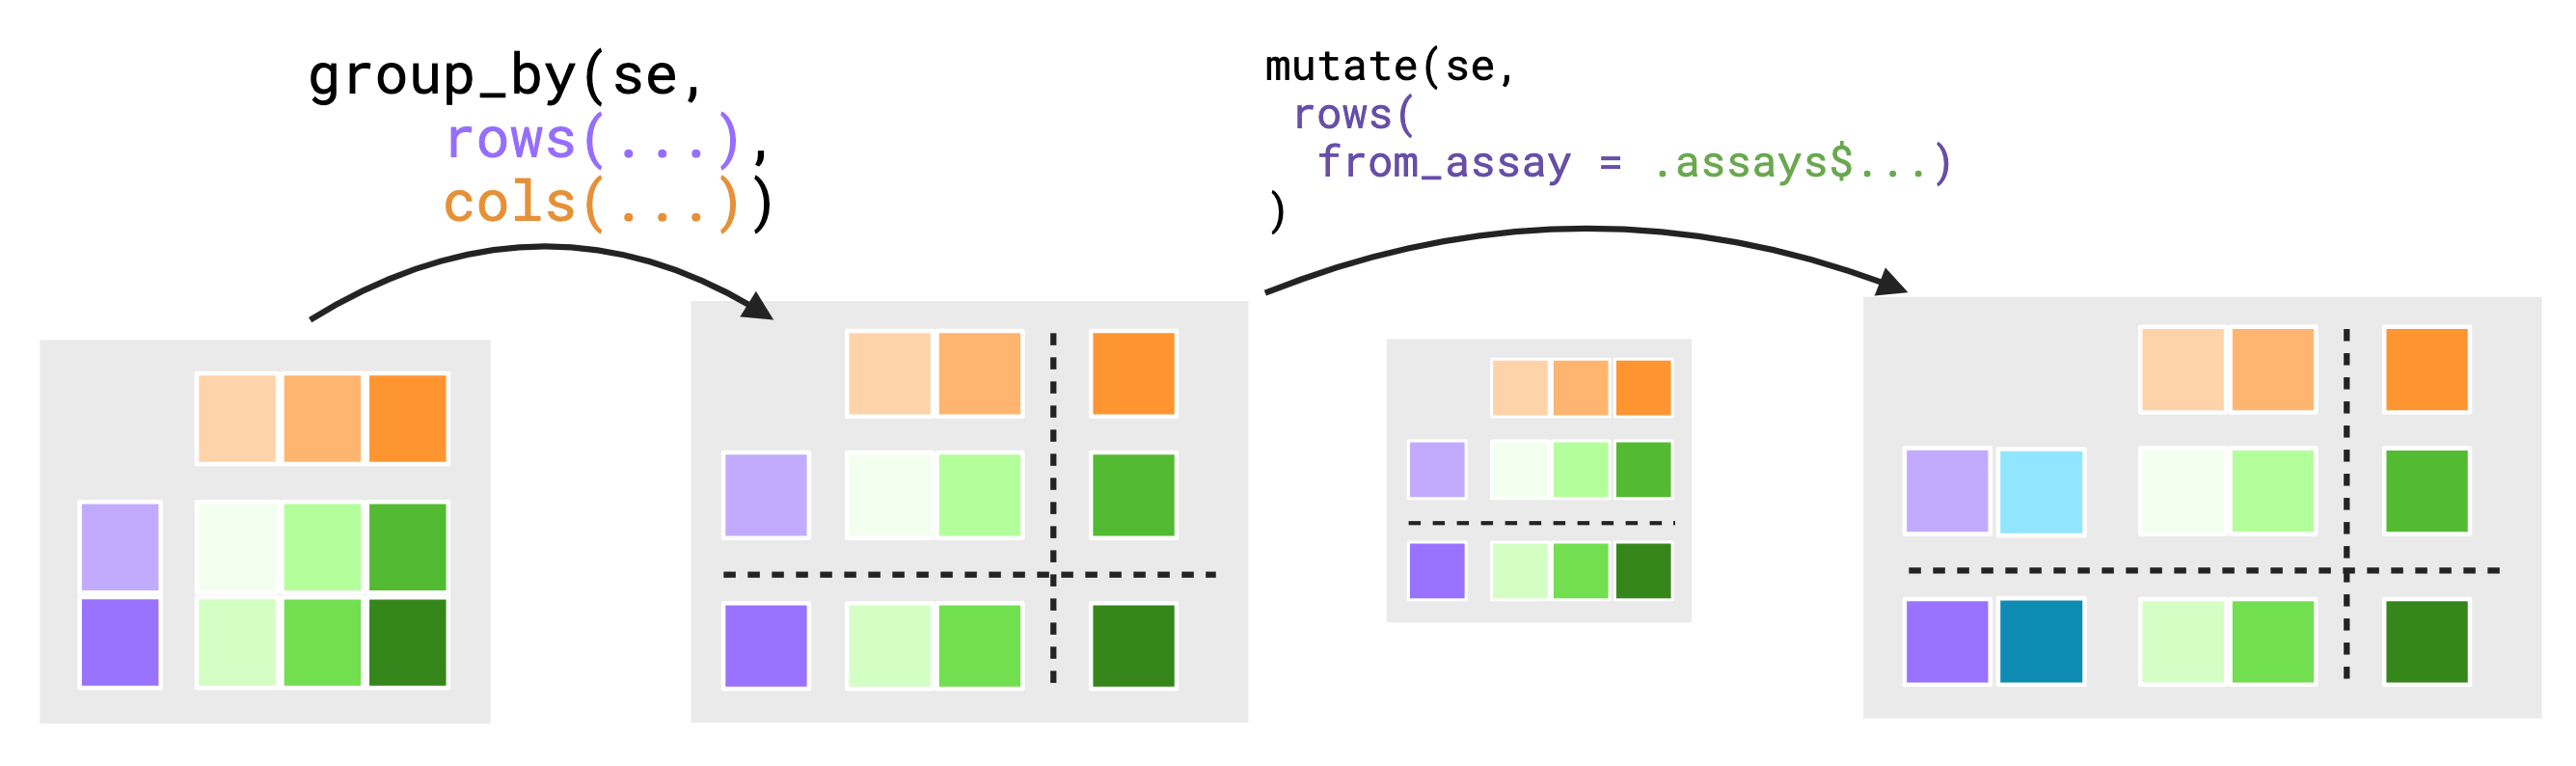
To further motivate this choice, suppose we did not drop grouping
values. Assume you have a small 5 by 4 SummarizedExperiment
object. Both of the rowData() and colData()
are grouped such that there are 2 groups in both rowData()
and colData() totaling in 4 groups across the assays.
group_by(se_simple, rows(direction), cols(condition)) |>
  mutate(rows(data_from_cols = .cols$condition))
The above syntax implies we wish to move data from the
colData() into the rowData(). From a
previously established conventions, we would expect the output to be an
alias for
vctrs::vec_rep(list(condition), times = n()).
Additionally the rows() sentinal will expect that the
output of .cols$condition will need to match the size of
the evaluation context.
Unfortunately, this becomes extremely difficult to resolve with the
current conventions. Without dropping the cols() groupings,
each rows() grouping is evaluated equal to the number of
groups in cols(). At first glance, this may seem desirable,
but the problem arises when considering how theses outputs across groups
should be stored per group of rows(). For example, should
the output of the .cols$condition return a list equal to
the number of groups of the column context? If yes, we would need to
consider the size stability of the output context! Assuming that
rowData() has at least one group with three elements, there
is no guarentee it would fit (this also makes a poor assumption that the
elements of rowData() somehow correspond to the groups of
colData()). Thus we would be left with wrapping all the
results in a list and replicating to the appropriate size. When its all
said and done, we would have a list of lists, which is difficult to
reason about, potentionally unexpected and painful to work with. For
this reason the only groupings present in the rowData()
context are the groupings in rowData(), and similarly for
the colData() context.
Slicing
plyxp supports slice() and its convenience
variants slice_head(), slice_tail(),
slice_min(), slice_max() and
slice_sample(). Unlike their data.frame
counterparts, these verbs use the rows() and
cols() context functions to declare which dimension(s) of
the object to slice. The assay context is not available for slicing, as
removing individual cells of an assay would break the structure of the
object.
slice() takes integer positions:
## # A RangedSummarizedExperiment-tibble Abstraction: 5 × 2
##    .features     .samples | counts | gene_id gene_name gene_biotype | SampleName
##    <chr>         <chr>    |  <int> | <chr>   <chr>     <chr>        | <fct>
##  1 ENSG00000000… SRR1039… |    679 | ENSG00… TSPAN6    protein_cod… | GSM1275862
##  2 ENSG00000000… SRR1039… |      0 | ENSG00… TNMD      protein_cod… | GSM1275862
##  3 ENSG00000000… SRR1039… |    467 | ENSG00… DPM1      protein_cod… | GSM1275862
##  4 ENSG00000000… SRR1039… |    260 | ENSG00… SCYL3     protein_cod… | GSM1275862
##  5 ENSG00000000… SRR1039… |     60 | ENSG00… C1orf112  protein_cod… | GSM1275862
##  6 ENSG00000000… SRR1039… |    873 | ENSG00… TSPAN6    protein_cod… | GSM1275866
##  7 ENSG00000000… SRR1039… |      0 | ENSG00… TNMD      protein_cod… | GSM1275866
##  8 ENSG00000000… SRR1039… |    621 | ENSG00… DPM1      protein_cod… | GSM1275866
##  9 ENSG00000000… SRR1039… |    263 | ENSG00… SCYL3     protein_cod… | GSM1275866
## 10 ENSG00000000… SRR1039… |     40 | ENSG00… C1orf112  protein_cod… | GSM1275866
## # ℹ 4 more variables: cell <fct>, dex <fct>, albut <fct>, sizeFactor <dbl>
For slice_head() and slice_tail(), the
contexts must be empty, and only indicate which
dimension(s) to slice:
xp |>
  slice_head(rows(), cols(), n = 3)
## # A RangedSummarizedExperiment-tibble Abstraction: 3 × 3
## .features .samples | counts | gene_id gene_name gene_biotype | SampleName
## <chr> <chr> | <int> | <chr> <chr> <chr> | <fct>
## 1 ENSG000000000… SRR1039… | 679 | ENSG00… TSPAN6 protein_cod… | GSM1275862
## 2 ENSG000000000… SRR1039… | 0 | ENSG00… TNMD protein_cod… | GSM1275862
## 3 ENSG000000004… SRR1039… | 467 | ENSG00… DPM1 protein_cod… | GSM1275862
## 4 ENSG000000000… SRR1039… | 448 | ENSG00… TSPAN6 protein_cod… | GSM1275863
## 5 ENSG000000000… SRR1039… | 0 | ENSG00… TNMD protein_cod… | GSM1275863
## 6 ENSG000000004… SRR1039… | 515 | ENSG00… DPM1 protein_cod… | GSM1275863
## 7 ENSG000000000… SRR1039… | 873 | ENSG00… TSPAN6 protein_cod… | GSM1275866
## 8 ENSG000000000… SRR1039… | 0 | ENSG00… TNMD protein_cod… | GSM1275866
## 9 ENSG000000004… SRR1039… | 621 | ENSG00… DPM1 protein_cod… | GSM1275866
## # ℹ 4 more variables: cell <fct>, dex <fct>, albut <fct>, sizeFactor <dbl>
xp |>
  slice_tail(cols(), n = 2) |>
  colData()
## DataFrame with 2 rows and 5 columns
## SampleName cell dex albut sizeFactor
## <factor> <factor> <factor> <factor> <numeric>
## SRR1039520 GSM1275874 N061011 untrt untrt 0.999555
## SRR1039521 GSM1275875 N061011 trt untrt 0.957953slice_min() and slice_max() order by a
variable within a context. Here we compute the average count per gene,
and keep the five most highly expressed genes:
xp_ave <- xp |>
  mutate(rows(ave_count = rowMeans(.assays_asis$counts)))

xp_ave |>
  slice_max(rows(ave_count), n = 5) |>
  rowData()
## DataFrame with 5 rows and 4 columns
## gene_id gene_name gene_biotype ave_count
## <character> <character> <character> <numeric>
## ENSG00000115414 ENSG00000115414 FN1 protein_coding 328813
## ENSG00000011465 ENSG00000011465 DCN protein_coding 300740
## ENSG00000198804 ENSG00000198804 MT-CO1 protein_coding 267427
## ENSG00000156508 ENSG00000156508 EEF1A1 protein_coding 260605
## ENSG00000164692 ENSG00000164692 COL1A2 protein_coding 209321Slicing respects groupings within each context, so we can find the top genes per biotype, or the sample with the smallest library size per treatment:
xp_ave |>
  filter(rows(gene_biotype %in% c("protein_coding", "lincRNA"))) |>
  group_by(rows(gene_biotype)) |>
  slice_max(rows(ave_count), n = 3) |>
  rowData()
## DataFrame with 6 rows and 4 columns
## gene_biotype gene_id gene_name ave_count
## <character> <character> <character> <numeric>
## ENSG00000115414 protein_coding ENSG00000115414 FN1 328812.62
## ENSG00000011465 protein_coding ENSG00000011465 DCN 300740.00
## ENSG00000198804 protein_coding ENSG00000198804 MT-CO1 267426.88
## ENSG00000272761 lincRNA ENSG00000272761 RP11-572C15.6 35348.00
## ENSG00000245532 lincRNA ENSG00000245532 NEAT1 25066.50
## ENSG00000214548 lincRNA ENSG00000214548 MEG3 9949.38
xp |>
  mutate(cols(lib_size = colSums(.assays_asis$counts))) |>
  group_by(cols(dex)) |>
  slice_min(cols(lib_size), n = 1) |>
  colData()
## DataFrame with 2 rows and 6 columns
## dex SampleName cell albut sizeFactor lib_size
## <factor> <factor> <factor> <factor> <numeric> <numeric>
## SRR1039520 untrt GSM1275874 N061011 untrt 0.999555 19126151
## SRR1039513 trt GSM1275867 N052611 untrt 0.931442 15163415slice_sample() randomly samples rows and/or columns. An
empty context indicates a uniform sample, while a non-empty context (or
the weight_by argument) supplies sampling weights. Here we
take two samples per treatment group, and separately, a sample of genes
weighted by their average count:
## DataFrame with 4 rows and 5 columns
##                 dex SampleName     cell    albut sizeFactor
##            <factor>   <factor> <factor> <factor>  <numeric>
## SRR1039508    untrt GSM1275862  N61311     untrt   0.916150
## SRR1039516    untrt GSM1275870  N080611    untrt   0.901480
## SRR1039509    trt   GSM1275863  N61311     untrt   1.066867
## SRR1039513    trt   GSM1275867  N052611    untrt   0.931442
xp_ave |>
  slice_sample(weight_by = rows(ave_count), n = 5) |>
  rowData()
## DataFrame with 5 rows and 4 columns
## gene_id gene_name gene_biotype ave_count
## <character> <character> <character> <numeric>
## ENSG00000110697 ENSG00000110697 PITPNM1 protein_coding 699.250
## ENSG00000100865 ENSG00000100865 CINP protein_coding 419.125
## ENSG00000117394 ENSG00000117394 SLC2A1 protein_coding 2770.125
## ENSG00000136448 ENSG00000136448 NMT1 protein_coding 3164.250
## ENSG00000164692 ENSG00000164692 COL1A2 protein_coding 209320.625Note that n (or prop) should always be
passed by name. Due to argument checks in the dplyr generics,
some calls will error otherwise, e.g.
slice_head(xp, rows()) or
slice_min(xp, rows(foo), cols(bar)). See
?slice_extras for more details.
Printing
Motivated by the show/print function in
tidySummarizedExperiment, we visualize the data as if it was
tabular. plyxp offers the option to opt-in on this behavior
by setting the associated global option:
options("show_SummarizedExperiment_as_tibble_abstraction" = TRUE)Alternatively, you may use helper functions
use_show_tidy() and use_show_default() to
enable and disable this alternative printing respectively.
Since plyxp aims to leave the input data as-is when
possible, we have considered providing support for printing
S4Vectors within a tibble(). To be clear,
plyxp will not allow you to put
S4Vectors inside a tibble(), but will allow
for S4Vectors to be printed with pillar(), the
formatting engine behind tibble() pretty printing.
To enable this behavior, before any data is reported to the user, we
proxy any S4Vector with a custom vctrs_vctr
object with plyxp::vec_phantom(). In truth, the
vec_phantom object is a simple integer vector with a
“phantomData” attribute. This allows us to carry along
S4Vector through pillar()’s printing pipeline
until it is time to print the column.
The pillar_shaft() method for vec_phantom
will format the S4 data with plyxp_pillar_format() generic,
which by default calls S4Vectors::showAsCell(). Users are
free to create their own methods for S4 vectors that differ from
S4Vectors::showAsCell() if they like, as seen in
?`plyxp-printing`
Renaming rows or columns
Inspired by tidySummarizedExperiment, plyxp
provides access to the rownames and colnames of a
SummarizedExperiment object by installing
.features and .samples into the
rowData() and colData() contexts respectively.
These are special in that assigning a value to .features in
the rowData() context or .samples in the
colData() context does not create a new column, but changes
the rownames or colnames of the resulting object.
se_simple## # A SummarizedExperiment-tibble Abstraction: 5 × 4
## .features .samples | counts logcounts | gene length direction | sample
## <chr> <chr> | <int> <dbl> | <chr> <int> <chr> | <chr>
## 1 row_1 col_1 | 14 2.64 | g1 1 - | s1
## 2 row_2 col_1 | 19 2.94 | g2 24 + | s1
## 3 row_3 col_1 | 16 2.77 | g3 60 + | s1
## 4 row_4 col_1 | 11 2.40 | g4 39 - | s1
## 5 row_5 col_1 | 18 2.89 | g5 37 + | s1
## … … … … … … … … …
## n-4 row_1 col_4 | 9 2.20 | g1 1 - | s4
## n-3 row_2 col_4 | 4 1.39 | g2 24 + | s4
## n-2 row_3 col_4 | 20 3.00 | g3 60 + | s4
## n-1 row_4 col_4 | 3 1.10 | g4 39 - | s4
## n row_5 col_4 | 5 1.61 | g5 37 + | s4
## # ℹ n = 20
## # ℹ 1 more variable: condition <chr>
# moving data to rownames and colnames
se_simple |>
  mutate(
    orig_names = sprintf(
      "%s-%s",
      # .features is installed in the rows() context
      .rows$.features,
      # .samples is installed in the cols() context
      .cols$.samples),
    rows(.features = gene,
         # deleting rowData column
         gene = NULL),
    cols(.samples = sample,
         # deleting colData column
         sample = NULL)
  )
## # A SummarizedExperiment-tibble Abstraction: 5 × 4
## .features .samples | counts logcounts orig_names | length direction |
## <chr> <chr> | <int> <dbl> <chr> | <int> <chr> |
## 1 g1 s1 | 14 2.64 row_1-col_1 | 1 - |
## 2 g2 s1 | 19 2.94 row_2-col_1 | 24 + |
## 3 g3 s1 | 16 2.77 row_3-col_1 | 60 + |
## 4 g4 s1 | 11 2.40 row_4-col_1 | 39 - |
## 5 g5 s1 | 18 2.89 row_5-col_1 | 37 + |
## … … … … … … … …
## n-4 g1 s4 | 9 2.20 row_1-col_4 | 1 - |
## n-3 g2 s4 | 4 1.39 row_2-col_4 | 24 + |
## n-2 g3 s4 | 20 3.00 row_3-col_4 | 60 + |
## n-1 g4 s4 | 3 1.10 row_4-col_4 | 39 - |
## n g5 s4 | 5 1.61 row_5-col_4 | 37 + |
## # ℹ n = 20
## # ℹ 1 more variable: condition <chr>Best practices
There is some overhead in creating the evaluation mask per dplyr
verb. It is recommended to try to reduce the number of
dplyr verb calls and instead increase the content of each
verb. For example instead of doing:
do the following:
.data |>
  mutate(
    foo = bar,
    baz = foo^2
  )
Community and support
Please feel free to post questions about plyxp to:
- the Bioconductor support site
- as an Issue on GitHub
- in the
#tidiness_in_biocchannel on the community-bioc Slack
For code contributions:
- For small fixes, feel free to post a PR on GitHub
- For larger structural changes to the package code, please reach out to the development team first through one of the above channels.
Thanks for your interest in plyxp!
Session info
devtools::session_info()## ─ Session info ───────────────────────────────────────────────────────────────
## setting value
## version R version 4.5.2 (2025-10-31)
## os Ubuntu 24.04.3 LTS
## system x86_64, linux-gnu
## ui X11
## language en
## collate en_US.UTF-8
## ctype en_US.UTF-8
## tz UTC
## date 2026-11-05
## pandoc 3.8.2.1 @ /usr/bin/ (via rmarkdown)
## quarto 1.7.32 @ /usr/local/bin/quarto
##
## ─ Packages ───────────────────────────────────────────────────────────────────
## package * version date (UTC) lib source
## abind 1.4-8 2024-09-12 [1] RSPM (R 4.5.0)
## airway * 1.30.0 2025-10-30 [1] Bioconductor 3.22 (R 4.5.2)
## Biobase * 2.70.0 2025-10-29 [1] Bioconductor 3.22 (R 4.5.2)
## BiocGenerics * 0.56.0 2025-10-29 [1] Bioconductor 3.22 (R 4.5.2)
## bslib 0.12.0 2026-08-04 [2] RSPM (R 4.5.0)
## cachem 1.1.0 2024-05-16 [2] RSPM (R 4.5.0)
## cli 3.6.6 2026-04-09 [2] RSPM (R 4.5.0)
## DelayedArray 0.36.1 2026-03-31 [1] Bioconductor 3.22 (R 4.5.2)
## desc 1.4.3 2023-12-10 [2] RSPM (R 4.5.0)
## devtools 2.5.2 2026-04-30 [2] RSPM (R 4.5.0)
## digest 0.6.39 2025-11-19 [2] RSPM (R 4.5.0)
## dplyr * 1.2.1 2026-04-03 [1] RSPM (R 4.5.0)
## ellipsis 0.3.3 2026-04-04 [2] RSPM (R 4.5.0)
## evaluate 1.0.5 2025-08-27 [2] RSPM (R 4.5.0)
## fastmap 1.2.0 2024-05-15 [2] RSPM (R 4.5.0)
## fs 2.1.0 2026-04-18 [2] RSPM (R 4.5.0)
## generics * 0.1.4 2025-05-09 [1] RSPM (R 4.5.0)
## GenomicRanges * 1.62.1 2025-12-08 [1] Bioconductor 3.22 (R 4.5.2)
## glue 1.8.1 2026-04-17 [2] RSPM (R 4.5.0)
## htmltools 0.5.9 2025-12-04 [2] RSPM (R 4.5.0)
## htmlwidgets 1.6.4 2023-12-06 [2] RSPM (R 4.5.0)
## IRanges * 2.44.0 2025-10-29 [1] Bioconductor 3.22 (R 4.5.2)
## jquerylib 0.1.4 2021-04-26 [2] RSPM (R 4.5.0)
## jsonlite 2.0.0 2025-03-27 [2] RSPM (R 4.5.0)
## knitr 1.52 2026-09-06 [2] RSPM (R 4.5.0)
## lattice 0.23-1 2026-08-12 [3] RSPM (R 4.5.0)
## lifecycle 1.0.5 2026-01-08 [2] RSPM (R 4.5.0)
## magrittr 2.0.5 2026-04-04 [2] RSPM (R 4.5.0)
## Matrix 1.7-6 2026-07-25 [3] RSPM (R 4.5.0)
## MatrixGenerics * 1.22.0 2025-10-29 [1] Bioconductor 3.22 (R 4.5.2)
## matrixStats * 1.5.0 2025-01-07 [1] RSPM (R 4.5.0)
## memoise 2.0.1 2021-11-26 [2] RSPM (R 4.5.0)
## otel 0.2.0 2025-08-29 [2] RSPM (R 4.5.0)
## pillar 1.11.1 2025-09-17 [2] RSPM (R 4.5.0)
## pkgbuild 1.4.8 2025-05-26 [2] RSPM (R 4.5.0)
## pkgconfig 2.0.3 2019-09-22 [2] RSPM (R 4.5.0)
## pkgdown 2.2.1 2026-07-07 [2] RSPM (R 4.5.0)
## pkgload 1.5.3 2026-06-15 [2] RSPM (R 4.5.0)
## plyxp * 1.7.8 2026-11-05 [1] Bioconductor
## purrr 1.2.2 2026-04-10 [2] RSPM (R 4.5.0)
## R6 2.6.1 2025-02-15 [2] RSPM (R 4.5.0)
## ragg 1.5.2 2026-03-23 [2] RSPM (R 4.5.0)
## rlang 1.3.0 2026-07-05 [2] RSPM (R 4.5.0)
## rmarkdown 2.32 2026-09-01 [2] RSPM (R 4.5.0)
## S4Arrays 1.10.1 2025-12-01 [1] Bioconductor 3.22 (R 4.5.2)
## S4Vectors * 0.48.1 2026-04-05 [1] Bioconductor 3.22 (R 4.5.2)
## S7 0.2.2 2026-04-22 [1] RSPM (R 4.5.0)
## sass 0.4.10 2025-04-11 [2] RSPM (R 4.5.0)
## Seqinfo * 1.0.0 2025-10-29 [1] Bioconductor 3.22 (R 4.5.2)
## sessioninfo 1.2.4 2026-06-04 [2] RSPM (R 4.5.0)
## SparseArray 1.10.10 2026-03-30 [1] Bioconductor 3.22 (R 4.5.2)
## SummarizedExperiment * 1.40.0 2025-10-29 [1] Bioconductor 3.22 (R 4.5.2)
## systemfonts 1.3.2 2026-03-05 [2] RSPM (R 4.5.0)
## textshaping 1.0.5 2026-03-06 [2] RSPM (R 4.5.0)
## tibble * 3.3.1 2026-01-11 [2] RSPM (R 4.5.0)
## tidyr 1.3.2 2025-12-19 [1] RSPM (R 4.5.0)
## tidyselect 1.2.1 2024-03-11 [1] RSPM (R 4.5.0)
## usethis 3.2.2 2026-09-10 [2] RSPM (R 4.5.0)
## utf8 1.2.6 2025-06-08 [2] RSPM (R 4.5.0)
## vctrs 0.7.3 2026-04-11 [2] RSPM (R 4.5.0)
## withr 3.0.3 2026-06-19 [2] RSPM (R 4.5.0)
## xfun 0.62 2026-10-16 [2] RSPM (R 4.5.0)
## XVector 0.50.0 2025-10-29 [1] Bioconductor 3.22 (R 4.5.2)
## yaml 2.3.12 2025-12-10 [2] RSPM (R 4.5.0)
##
## [1] /__w/_temp/Library
## [2] /usr/local/lib/R/site-library
## [3] /usr/local/lib/R/library
## * ── Packages attached to the search path.
##
## ──────────────────────────────────────────────────────────────────────────────